Partners

find a partner

Need to find a partner of Mainstream AV-Flowmeters near you? Just fill out the form below and we will be happy to send you the partner details.

    become a partner

    Mainstream™ MEASUREMENTS Ltd is actively seeking partners worldwide to represent them in the marketing, selling and distribution of their products. We require that partners can fulfill systems specification; integration; commissioning and installation. Partners with a demonstrable track record of selling open channel flowmeters are welcomed!

    For further information please fill in the form below and we will be in touch or contact us :

    Call: +44 (0) 01535 654333
    9:00 – 17:00 GMT Mon – Thur; 8.00 – 13.00 GMT Fri

    Email: support@mainstream-measurements.com

      Support Helpline

      If you would like any further information on Mainstream, our range of equipment or to request a quote you can contact us either via a phone call or by email. Please choose an option and click on one of the icons below to get in touch with us. Our phone lines are open: 9:00 – 17:00 GMT Mon – Thur; 8.00 – 13.00 GMT Fri.

      Call us:
      +44 (0) 1535 654333

      Email us:
      support@mainstream-measurements.com

      Product Guide & User Manual

      For a full list of our products at Mainstream Measurements, you can now download our full brochure to browse at your own leisure. The latest brochure is available in both English and French.

      Great Britain Download Mainstream Measurements Product Brochure

      Great Britain Download Mainstream Measurements User Manual

      France Download Mainstream Measurements Product Brochure

      Our user manual covers the following Mainstream products:

      Mainstream Measurements

      mainstream™

      AV-Flow Transmitter

      Velocity Transmitter

      Mainstream Measurements

      mainstream™

      AV-Flow Transmitter

      AV-Flow Transmitter

      Mainstream Measurements

      mainstream™

      Compact Fixed AV-Flowmeter

      Compact Fixed AV-Flowmeter

      Mainstream Measurements

      mainstream™

      Premier Fixed AV-Flowmeter

      Premier Fixed AV-Flowmeter

      Mainstream Measurements

      mainstream™

      Portable AV-Flowmeter

      Portable AV-Flowmeter

      Troubleshooting

      Below you will be able to find answers to the most common problems and questions that you may encounter and needs answers for. If you are having any issues that cannot be resolved in this troubleshooting section then please do not hesitate to contact us.

      The Level to Area table can be created in a spreadsheet and must be saved as a comma separated .CSV file.

      The table must consist of 2 columns lefthand column being level (mm) and righthand column being area (sq mtrs).

      The table can have a maximum of 99 points including the first point level = 0 and area = 0

      The level must be in millimetres and the area in sq Mtrs.

      The level measurements should also be added in ascending order.

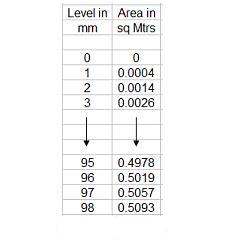
      In Communicator under Application / Pipe/Channel Section / Level/Area table .CSV File Interface select Import.

      Select the generated .csv fle and this will populate the Level/Area Table.

      Select Apply.

      Please check connections – see below:

      ts1

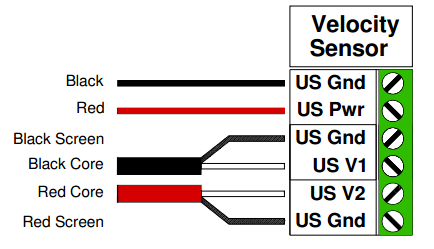
      Reversing connections US V1 and US V2 will result in a negative flow reading

      ts2

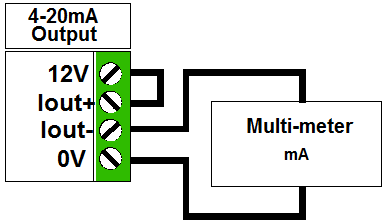
      On 4-20 mA output terminals, fit link between 12V and Iout+ connectors. Set Multi-meter to read mA and measure between Iout- and 0V terminals. In Mainstream Communicator, select Outputs / 4-20mA / Calibration. You can now calibrate the outputs using the meter and also test their linearity.

      Using your example (2), set 4 mA to correspond to -4,000 m3/hr and 20 mA to correspond to 4,000 m3/hr.  At zero flow (half way between the two set points) the output will be half way between 4 mA and 20 mA, i.e. 12 mA.
      Inside the Mainstream, flow quantities are calculated in litres.  Mainstream uses 32-bit floating point numbers for the internal calculations.  This gives a number range from 10^-63 to 10^63.  Precision is 1 part in 16 million  – better than seven decimal digits.

      The minimum quantity that can be represented is 10^-60 cubic millimetres – much smaller than the volume of a water molecule.  The maximum quantity that can be represented is 10^60 cubic metres – larger than the volume of the solar system.

      The totalizer never automatically resets (wraps round) to zero.  It only needs to be reset for operational reasons, or to limit the accumulation of errors.

      If you increase the 15° elevation angle, for example by placing a wedge underneath the probe, the Zone of Inspection can penetrate further into the flow but you decrease the probe scale factor and increase the sensitivity to fluid motion transverse to the channel axis, e.g. swirl.  In the limit, if you direct the ultrasound beam across the flow you should only detect this transverse motion and be unable to detect the mean flow velocity.  The elevation angle and beam width were chosen to give the best compromise.

      If the flow velocity is above the maximum 5 m/s that Mainstream can measure you need to change the configuration of the flow.  A partial blockage downstream of the velocity probe is sometimes effective, or a horizontal section followed by a weir.  The pipe diameter (or maximum flow rate) determines whether alterations to the flow structure can be cost effective.

      Mainstream has worked with up to 2 metres diameter pipes in waste water.  We do not normally recommend operating the Mainstream flowmeter in pipes greater than 2.5 to 3 metres in diameter and channels greater than 2.5 to 3 metres wide.  This is because the flow information collected by the velocity probe typically extends up to about 1.5 metres into the flow.
      It is possible to use the Mainstream flowmeter in larger channels in much the same way that an insertion probe is used to indicate the flow in a large pipe.  In a channel, you use velocity measurements from the Mainstream taken at a sequence of points across the section to establish the velocity profile.  Averaging these gives the mean velocity.  You then place the velocity probe in the location where it is to be installed, typically looking across the channel, and record the indicated velocity.  Set the probe scale factor to 0.736 x mean velocity / indicated velocity and the Mainstream reads the correct flow rate.

      Clearly, this only works well when the velocity profile is stable – prismatic channel with no obstructions or flow into or out of the channel near to the measurement site – and when the range of level is limited.  However, within these limitations the Mainstream will give useful flow information.

      The velocity probe will only measure the velocity in the ‘zone of inspection’ so you should position the probe to get best coverage of the flow. If you do not want to install the probe very close to the bottom of the pipe/channel it is usually because of debris and settled solids.  The measurement is better if you keep above this level.  You lose information from below the probe but you get good information from the rest of the flow.
      We have looked at making a .DFX interface but it will not appear from some time yet.  If you cannot input the pipe/channel section using the graphics tools you can specify and load this information as a level-area table.  Within Communicator you need to configure the units to be used.
      Not directly, but you can produce a spreadsheet that will calculate a level-area table when you input the key dimensions.  Create a .CSV file in Excel with one column for Level and one for Area.  Calculate an area for a specified level and then copy that formula through other specified levels.  Go to the Channel Section Editor and import the .CSV file.
      If you retrieve the logged data into a spreadsheet e.g. Excel, you can use the graphics tools to produce time histories.  One useful trick is to plot level against velocity.  This can be used to show that you have stable hydraulic conditions – the channels is not being blocked/unblocked.
      This depends very much on the application.  If you notice that the signal quality is falling this suggests that the probe may be becoming covered in debris and needs cleaning.  You can do this in place with a brush or similar.  You can usually learn about the needs of an application and set up a routine – perhaps every three or four weeks – sometimes more frequently – sometimes less.
      The sensors can be subject to physical damage by debris carried by the flow.  In this case you can sometimes mount the sensor pointing downstream and fit a cover for protection.

      Very rapid changes in temperature (thermal shocks) are bad for the sensor.  Avoid this if at all possible.

      You should always keep water out of the system unit.  If possible mount the system unit out of direct sunlight as prolonged high temperatures can damage the LCD.

      You can go to VELOCITY, CONFIGURATION and then select Noise Suppression where there is a drop down menu to select from Small to Very Large.  Ensure that Histogram Averaging is enabled. OK then Apply.

      Don’t change the sampling interval – that controls the velocity range.

      Recording frequency cannot vary according to the flow or level.  Simply set the recording rate to the highest required and discard any unwanted data.
      The flow is totalised in the hour quantity.  Every hour, on the hour, the hour quantity is added to the total quantity and the hour quantity is then cleared.

      The engineering units only affects the quantity displays.  The actual quantities are unchanged.  If gallons are selected it will display gallons and total gallons.  If cubic metres are selected it will display cubic metres.

      Mainstream use 32 bit floating point numbers.  To prevent round off errors it is necessary to use two totalisers.  So, we accumulate the flow for one hour and then add this to the total.  You can use the PC software reset totals function which clears both the hour quantity and the total quantity.  At the end of your test you can add the hour quantity and the total quantity to give you the total flow during your test.
      1. To check the voltage, using a multimeter measure between the Ground and Level Source. A voltage of between 10-12 V should be recorded.

      2. To check the current, remove the SENSE lead and connect it to a multimeter (set to current) in series. The current should measure between 4mA to 20mA depending on the depth of the PTX.

      All velocity measurements are logged and stored as a histogram; the Mainstream has the ability to determine two velocities for the histogram.  The velocity check is the most frequent occurring figure.  The mean velocity  is the average of all the entries

      velocity check

      Mean Velocity  = S(velocity x frequency of occurrence)/no. entries
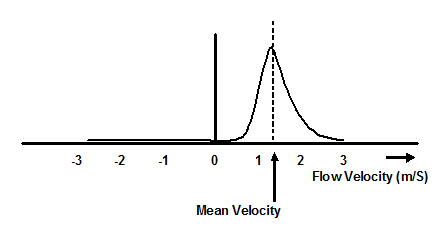
      It shows the distribution of tracer velocities in the “zone of inspection” of the velocity probe.

      ts4

      All velocity probes give better than an 80% signal quality at a velocity of 80mm/S in our test rig which is filled  from a drinking water supply.  Therefore a minimal number of particles is needed to provide a signal.
      The sensor must be mounted in a position such that the sensor is always covered by at least 30 mm of liquid.  In larger open channels (e.g. trapezoidal) the sensor can be mounted either on the bottom or side of the channel.
      The existing Mainstream product range can use only two level sensors and one velocity sensor.
      The ultrasound from the probe can penetrate several metres into the flow and the velocity histogram from which the flow velocity is calculated is constructed from all verified velocity data in the received ultrasound.
      It is possible to configure the Mainstream to measure velocities as low as a few millimetres per second.  With this configuration the maximum velocity would be below 1 metre per second.  We consider that the main problem with very low velocities is that the air bubbles and particles on which the velocity measurement depends might separate from the flow.  We also suspect that in the situation of detecting flow reversals for use in a tidal control gate, the flow might separate into upper and lower layers traveling opposite directions.  In this case the velocity histogram would contain both positive and negative velocities and the Mainstream would give zero signal quality and zero velocity.
      Turndown ratio is 100:1 is often used to compare the span – the range – of flow measurement devices.
      When the probe face is upstream, the flow is unaffected by the velocity probe.  When the probe face is downstream it must be shielded against large debris.
      Probe scale factor is independent of the flow direction.
      The maximum working temperature is 80º C; the air temperature is no more than 50º C

      Data Sheets & Product Comparison

      Mainstream Measurements

      mainstream™

      AV-Flow Transmitter

      Velocity Transmitter

      Mainstream Measurements

      mainstream™

      AV-Flow Transmitter

      AV-Flow Transmitter

      Mainstream Measurements

      mainstream™

      Compact Fixed AV-Flowmeter

      Compact Fixed AV-Flowmeter

      Mainstream Measurements

      mainstream™

      Premier Fixed AV-Flowmeter

      Premier Fixed AV-Flowmeter

      Mainstream Measurements

      mainstream™

      Portable AV-Flowmeter

      Portable AV-Flowmeter

      Mainstream Measurements

      mainstream™

      MainProbe-Vu

      MainProbe-Vu RS485 Modbus

      Product Comparison Chart

      Videos

      You can learn more about our products today with the below Mainstream Measurements video tutorials.

      Calibration Video

      Learn how to calibrate your level sensor

      fixed unit quick start guide

      Learn how to get up and running

      Software Video

      Learn how to install and use Mainstream software

      Portable unit quick start guide

      Learn how to get up and running

      Sensor Installation Examples

      This document is a guide to the types of mounting hardware available for use in open channels and part-filled pipes. This document talks through sensor installation examples and how to mount them in different types of applications.

      Download Guide

      MAINPROBE-Vu RS485 downloads

      download product information

      Communicator Management and setup program for MainProbe Modbus
      MainProbe User Manual Comprehensive reference to the MainProbe Modbus
      MainProbe Quick Start Guide Short version of manual with key information
      MainProbe Cheat-Sheet Single page document containing key Modbus registers and connection information
      Data Sheet (English) Product technical information
      Data Sheet (French) Product technical information